

Next: `Special' deformations
Up: The white noise approximation
Previous: The white noise approximation
Relation to random wave approximation
The uncorrelated impulse picture of the WNA is an intuitive
estimate for
the classical band profile
 .
However, it gives little understanding in the quantum case.
The quantum band profile expresses off-diagonal structure in the
matrix
 .
The matrix elements are given in a hard-walled system by Eq.(C.2),
the weighted overlap of eigenstates
  and
and  on the boundary.
Therefore a first approximation to the quantum band profile might
be reached by assuming that the eigenstates
are random sums of plane waves (Berry's postulate).
Furthermore one could assume no correlations between states
  .
The number of independent
 -sized patches on the billiard
surface is
 , and these will add in a
  fashion
because they are uncorrelated.
Over each patch the typical squared eigenfunction normal derivative
is
 .
Combining with (2.48) and the fact that in
  dimensions
the mean level spacing is
 gives
gives
 |
(3.13) |
where  is the typical value of
 .
Note that the predicted band profile is flat (independent of
  )
because the overlap of random waves on the boundary does not depend strongly
on their wavenumber difference.
Also note that
  does not appear in this quantum estimate.
The similarity to (3.12) is clear.
Performing the above calculation more carefully with the correct
prefactors (this lengthy result is derived in [46])
gives exactly (3.12).
So, remarkably, a random wave estimate in quantum mechanics is equivalent
to the WNA in classical mechanics, as far as the naive band profile
prediction is concerned.
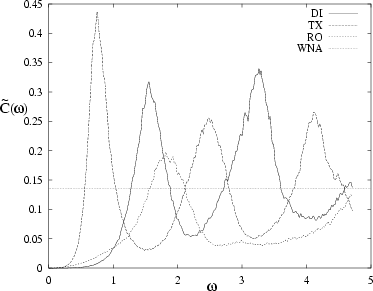
Figure:
The WNA estimate compared to actual
 power spectra for example `special' deformation types:
DI (dilation), TX (translation) and RO (rotation).
See Table 3.2 for definitions.
The WNA fails to predict the vanishing in the small
  limit.
 |
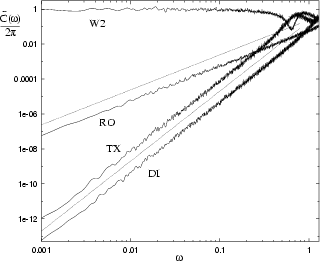
Figure 3.6:
Similar to Fig. 3.5 except a log-log plot.
This demonstrates the special deformation power laws.
The two dotted lines show  and
and  frequency dependence, for purposes of comparison.
A non-special deformation (W2) is also shown to contrast its small-
 dependence.
Estimation error here is 13% for W2 and RO, 20% for DI and TX.
 |
Table 3.2:
Key to the four `special' deformations in 2D.
The unit vectors  and
and  are
in the plane (see Fig. 1),
and
  is in the
perpendicular direction.
In the case of dilation and rotation
  could be made unitless by dividing by a constant length.
| key |
description |
deformation field |
| DI |
dilation about origin |
 |
| TX |
 -translation -translation |
 |
| TY |
 -translation -translation |
 |
| RO |
rotation about origin |
 |
|


Next: `Special' deformations
Up: The white noise approximation
Previous: The white noise approximation
Alex Barnett
2001-10-03
![]() .
However, it gives little understanding in the quantum case.
The quantum band profile expresses off-diagonal structure in the
matrix
.
However, it gives little understanding in the quantum case.
The quantum band profile expresses off-diagonal structure in the
matrix
![]() .
The matrix elements are given in a hard-walled system by Eq.(C.2),
the weighted overlap of eigenstates
.
The matrix elements are given in a hard-walled system by Eq.(C.2),
the weighted overlap of eigenstates ![]() and
and ![]() on the boundary.
Therefore a first approximation to the quantum band profile might
be reached by assuming that the eigenstates
are random sums of plane waves (Berry's postulate).
Furthermore one could assume no correlations between states
on the boundary.
Therefore a first approximation to the quantum band profile might
be reached by assuming that the eigenstates
are random sums of plane waves (Berry's postulate).
Furthermore one could assume no correlations between states ![]() .
The number of independent
.
The number of independent
![]() -sized patches on the billiard
surface is
-sized patches on the billiard
surface is
![]() , and these will add in a
, and these will add in a ![]() fashion
because they are uncorrelated.
Over each patch the typical squared eigenfunction normal derivative
is
fashion
because they are uncorrelated.
Over each patch the typical squared eigenfunction normal derivative
is
![]() .
Combining with (2.48) and the fact that in
.
Combining with (2.48) and the fact that in ![]() dimensions
the mean level spacing is
dimensions
the mean level spacing is
![]() gives
gives

