Resources
Math 3 Course Home Page
Math 3 Course Syllabus
Practice Exams
Textbook Home Page
Post a Comment
Contents
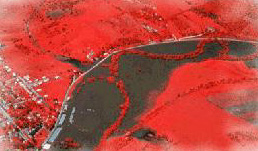
In this lecture we consider a real-world application of modeling with accumulations by developing a case study on river flooding. This material is the extended application and culmination of our work in lectures 21-26.
Quick Question
What is the approximate area under the graph of the function 1/(1 + x) on the interval [0,1] using the two inscribed rectangles on the intervals [0,1/3] and [1/3,3/4]? (You need not simplify your answer.)
Outline
Outline for Case Study: Flood WatchTextbook
Case Study: Flood WatchToday's Homework
Log into WebWorKQuiz
Case Study: Flood Watch QuizExamples
 Calculate the centroid of the region between the curves f(x) = x2 + 2 and g(x) = 2x + 5 for x in the interval [–1, 3].
- A certain river has rainfall discharge data and rainfall recorded during and after a storm. Find the base flow of the river, the total volume of rainfall discharge, and the lag time between the rainfall event and the rainfall discharge.
- A flower grows at varying rates, measured at the beginning of each month and halfway through each month, according to a chart. What is the approximate height of the flower after three months? Consider a second flower that requires fertilizer to grow, and compute the lag time between the application of fertilizer and the flower's growth.
Applets
-
 Flood Watch
Videos
-
 Find the x coordinate of the centroid
of the region bounded by y = 0, y = x2, x = 0, x = 1
Find the x coordinate of the centroid
of the region bounded by y = 0, y = x2, x = 0, x = 1
-
Find the y coordinate of the centroid
of the region bounded by y = 0, y = x2, x = 0, x = 1