Examples of a `special' deformation and a `generic' deformation were used
(see Chapters 3 and 4).
The special deformation chosen was rotation about the origin (lower-left corner).
This corresponds to
![]() (see Table 3.2).
Because the special deformations preserve shape, the eigenstates of a
thus-deformed billiard are unchanged (space is invariant under translation
and rotation).
Therefore only one set of eigenstates is required for all
(see Table 3.2).
Because the special deformations preserve shape, the eigenstates of a
thus-deformed billiard are unchanged (space is invariant under translation
and rotation).
Therefore only one set of eigenstates is required for all ![]() values.
values.
The generic deformation used was
![]() , where
, where
![]() is the angle on the circular part of the boundary measured from the
vertical.
is the angle on the circular part of the boundary measured from the
vertical. ![]() on the top, left, and bottom straight sections of the
boundary. This has the effect of pushing out the curved part into an ellipse
(and a corresponding lengthening of the bottom straight section).
This deformation was chosen because it was possible to create large
deformations with minimum sacrifice to the quality of the basis-dependent
tension minima
on the top, left, and bottom straight sections of the
boundary. This has the effect of pushing out the curved part into an ellipse
(and a corresponding lengthening of the bottom straight section).
This deformation was chosen because it was possible to create large
deformations with minimum sacrifice to the quality of the basis-dependent
tension minima ![]() .
.
Generally, it has been found that almost any non-special deformation
of the stadium creates a shape for which the RPW basis becomes much worse,
and that improvement by addition of EPWs is also limited.
For deformations that are localized on the perimeter, this renders the
problem unsolvable if ![]() approaches
approaches
![]() (de Broglie wavelength) or larger.
In the above choice of deformation at
(de Broglie wavelength) or larger.
In the above choice of deformation at ![]() it was possible to deform from
it was possible to deform from ![]() to
to
![]() with a corresponding change in typical
tension from
with a corresponding change in typical
tension from
![]() to
to ![]() .
A few states of the deformed system had higher tensions of
.
A few states of the deformed system had higher tensions of ![]() .
This was acceptable for the calculation.
.
This was acceptable for the calculation.
At each ![]() , all the states in the wavenumber range
, all the states in the wavenumber range ![]() were gathered using multiple applications of the scaling method at choices
of
were gathered using multiple applications of the scaling method at choices
of ![]() equally spaced by
equally spaced by
![]() in wavenumber.
Thus only states falling within
in wavenumber.
Thus only states falling within
![]() were
kept from each scaling diagonalization.
This rather small value of
were
kept from each scaling diagonalization.
This rather small value of
![]() means that only about 2 states
were found per diagonalization.
However, because of the limitation of the basis set in such deformed shapes,
this gave the highest accuracy.
Because the scaling method is so fast, it did not slow down the overall
computation by much (the evaluation of eigenstate values and gradients on the
perimeter was the main bottleneck).
means that only about 2 states
were found per diagonalization.
However, because of the limitation of the basis set in such deformed shapes,
this gave the highest accuracy.
Because the scaling method is so fast, it did not slow down the overall
computation by much (the evaluation of eigenstate values and gradients on the
perimeter was the main bottleneck).
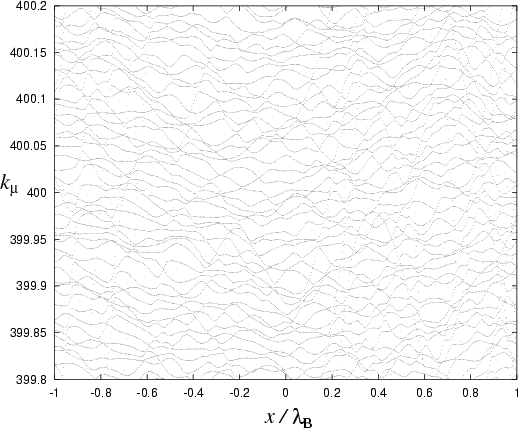 |
To illustrate the effect of deformation on the eigenvalues,
Fig. 6.13 shows their parameter-dependence under a (different)
generic deformation.
This was generated (to lower accuracy) by a single scaling diagonalization
at each ![]() value.
value.
 |
 |